States With the Best And Worst Drivers
The U.S. Northeast and Hawaii Have the Lowest Traffic Incident Rates
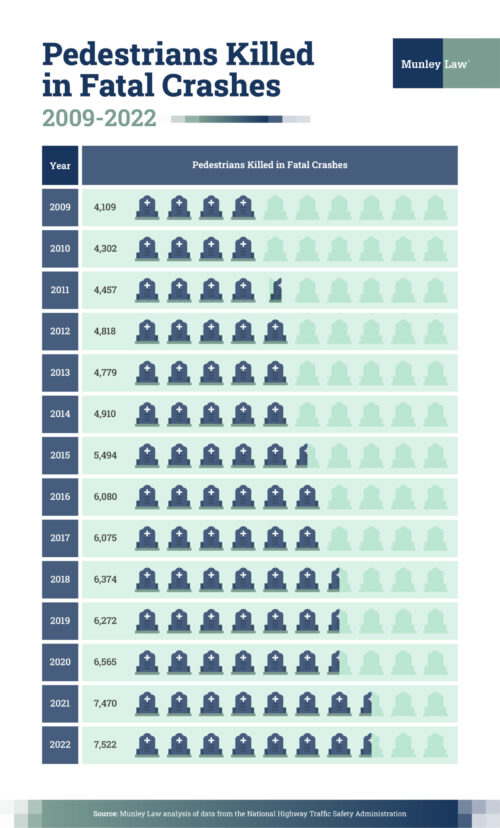
As of the latest data from the National Highway Safety Traffic Administration, the number of pedestrians killed by drivers in traffic accidents is at a recorded high, with 7,522 fatalities in 2022. The percentage of fatalities caused by drunk driving is also at a record high of 31.8% Overall, the U.S. has fallen behind other developed countries in preventing motor vehicle fatalities. The rate of car accident deaths in the U.S. is three times higher than in Canada and Australia, and more than five times higher than in Scandinavia, Switzerland or Britain.
Motor vehicles are the most common form of transportation in the U.S. — 75.4% of Americans commute to work using a car, truck or van, while only 2.5% used public transport. In total, drivers in the U.S. spent over 93 billion hours behind the wheel in 2022, with a daily average of 60.2 minutes per person. If you spend a large chunk of your day driving, it’s good to know how safe the drivers you share the road with really are.
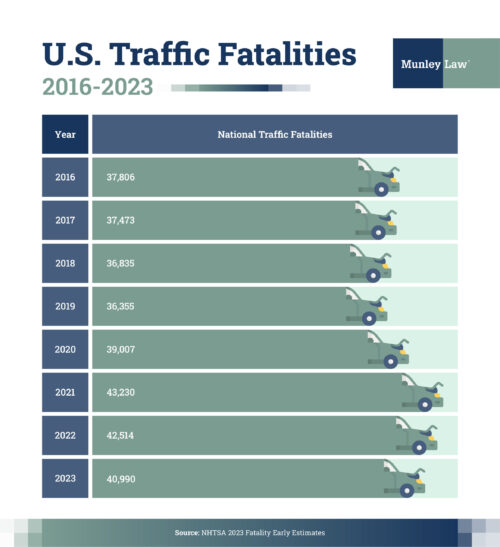
According to the NHTSA’s 2023 estimates, the total number of people killed in traffic accidents has been declining for the past two years. However, the number of traffic fatalities is still significantly higher than it was at any point between 2008 and 2019.
A variety of factors, such as speeding and driving under the influence, contribute to fatal accident rates in the United States. When you compare data between states it becomes clear that drivers in some states exhibit much higher rates of dangerous driving behaviors.
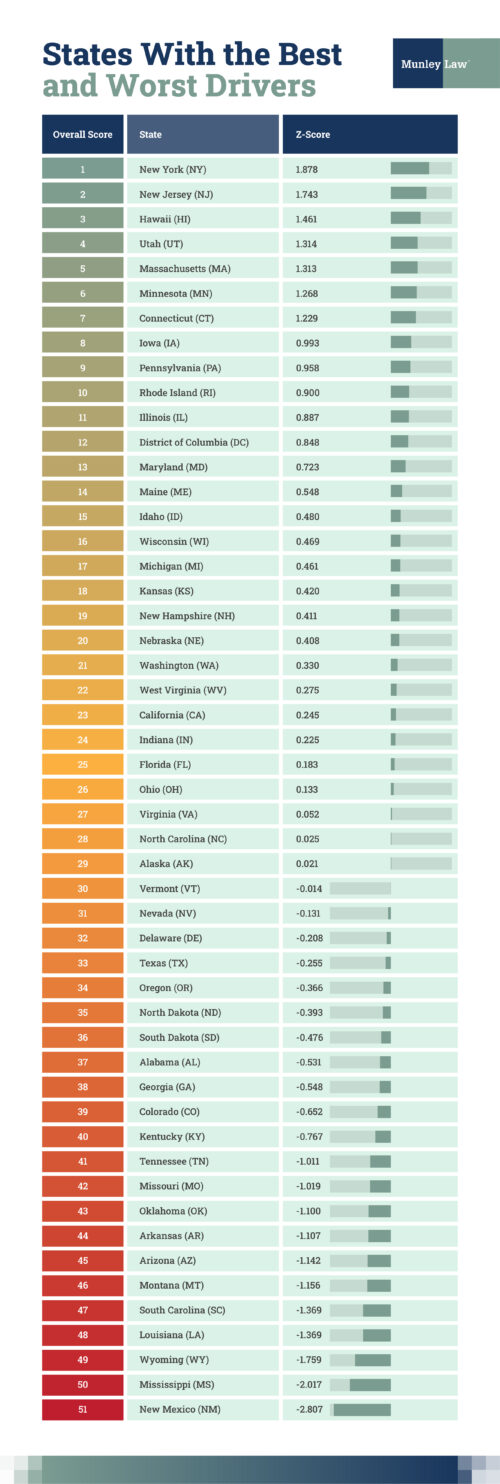
To determine which states have the Best and Worst Drivers, the car accident lawyers at Munley Law used the most recent federal data to compare nine different metrics in all 50 states and D.C., including fatal crashes, DUI arrests, drunk driving fatalities, observed seatbelt use, pedestrian traffic fatalities and more to create a comprehensive ranking. The complete methodology with links to all data sources is at the bottom of the study.
Key Findings
- New York No. 1 Best State: New York drivers have the average best score in all categories with low rates of speeding and drunk driving, and the second lowest number of traffic fatalities in the U.S.
- New Mexico No. 1 Worst State: New Mexico has some of the highest statistics for drunk driving and speeding-related traffic fatalities in the country. It’s also the state with the second most uninsured drivers in the U.S. — 24.9%.
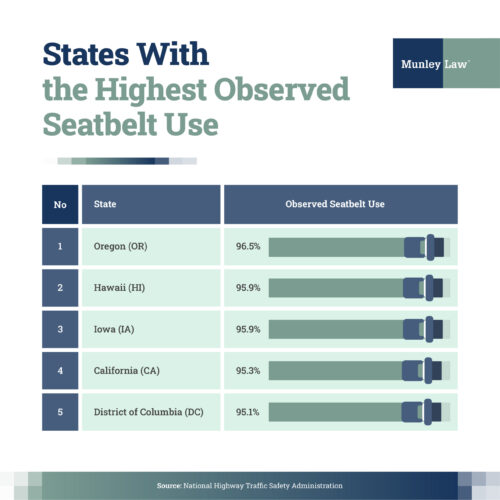
- States With Highest Observed Seatbelt Use: Oregon, Hawaii and Iowa are the three states whose drivers wear their seatbelts the most often.
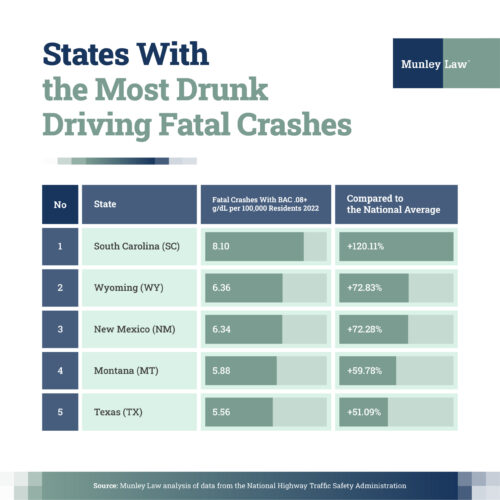
- States With the Highest Number Of Drunk Driving Crashes: South Carolina, Wyoming and New Mexico have the highest number of fatal motor vehicle crashes where the driver had a blood alcohol level above 0.08 g/dL.
Source: Munley Law analysis of data from the National Highway Traffic Safety Administration, U.S. Census Bureau, FBI Uniform Crime Reporting Program, Substance Abuse and Mental Health Services Administration and Insurance Information Institute.
States With the Best Drivers
Best Drivers — New York
While New York wasn’t number one in any single category, its consistently high performance across multiple metrics placed it in first place. New York had the second-lowest rate of overall traffic fatalities in 2023, and the third-lowest number of drunk driving fatal crashes. The state also scored above average in all the other categories in our ranking.
2nd Best Drivers — New Jersey
New Jersey was also an all-rounder. It tied with New York for the 3rd lowest rate of drunk driving fatal crashes in the country, had the 4th lowest rate of speeding-related fatal crashes and got above-average scores in all other categories.
3rd Best Drivers — Hawaii
Hawaii had low rates of drug use disorder and drunk driving crashes, and the third lowest rate of traffic fatalities in the U.S. The state also had the second-highest rate of observed seatbelt use, with 95.9% of drivers choosing to wear their seatbelts.
States With the Worst Drivers
Worst Drivers — New Mexico
New Mexico didn’t have the worst score in any single category, but it was consistently near the bottom in most of them, which is how it got the worst overall score. The state had the second-highest rate of speeding-related fatal crashes, the third-highest rate of drunk-driving fatal crashes and the third-highest rate of pedestrians and cyclists killed by motor vehicles. New Mexico also had the second-highest percentage of uninsured drivers in the country.
2nd Worst Drivers — Mississippi
Mississippi had the second-highest rate of motor vehicle fatalities and the third-highest percentage of uninsured drivers. The state scored below average in most other categories, which got it our second-worst overall score.
3rd Worst Drivers — Wyoming
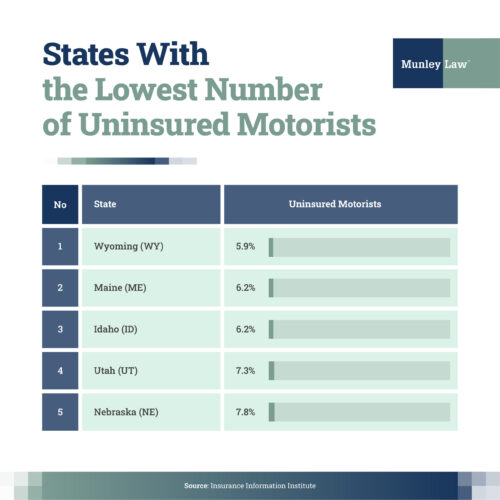
Wyoming had the highest rate of overall motor vehicle fatalities in the U.S., as well as the highest rate of speeding-related fatal crashes in 2022. However, pedestrian fatalities per 100,000 residents were only 1.38, well below the national average of 2.26. Wyoming also had the fewest uninsured drivers in the U.S., at only 5.9%.
States With the Most Drunk Driving Deaths
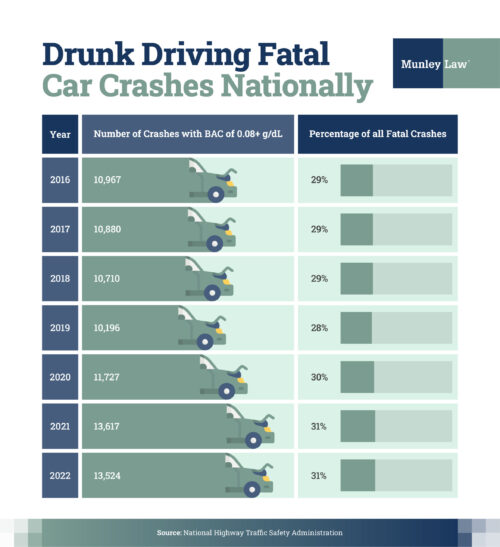
The number of people killed in drunk driving accidents in the U.S. rose sharply in 2020 and 2021. When someone has a blood alcohol level above 0.08 g/dL, their reaction time, judgment, and muscle coordination become impaired. In 2022, 31% of all fatal crashes in the U.S. involved a driver with a blood alcohol level above the legal limit.
The state with the highest number of drunk driving fatal crashes in 2022 was South Carolina, with an average of 8.10 crashes per 100,000 residents. This was almost 30% more than the next state, Wyoming. South Carolina’s number of fatal crashes was 120.11% higher than the national average of 3.68 per 100,000 people.
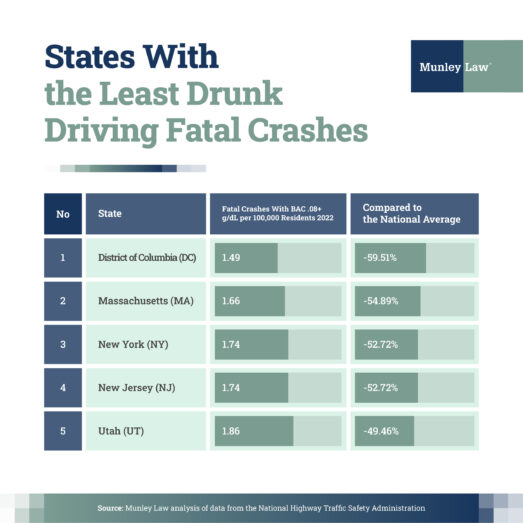
Washington, DC, had the lowest rate of fatal drunk driving crashes in 2022, with only 1.49 crashes per 100,000 residents, 59.51% less than the national average. Washington, DC, also had the fourth-lowest rate of DUI arrests in the country, with only 86 arrests per 100,000 residents.
Which States Are the Deadliest For Pedestrians?
Since 2009, the number of pedestrian fatalities in the U.S. has risen by over 80%. One contributing factor could be the way U.S. car designs have changed over the years.
Certain types of cars can be more dangerous to pedestrians. Vehicles with a front hood height above 40 inches are 45% more likely to cause fatalities in pedestrian crashes. Vehicles with hoods between 35 and 40 inches are also more likely to cause fatalities if the hood is blunt and vertical rather than sloped.
Large vehicles like SUVs and pickups are popular in the U.S., and car companies appear to be making them even larger every year. According to the Insurance Institute for Highway Safety, over the past 30 years, the average U.S. passenger vehicle has gotten about 4 inches wider, 10 inches longer, 8 inches taller, and 1,000 pounds heavier.
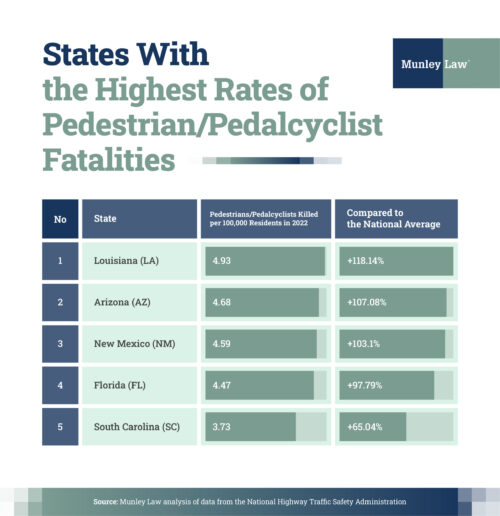
While California had the highest number of total pedestrian fatalities in the U.S. in 2022, the numbers begin to look different when you compare fatalities to state populations. When you look at the number of pedestrian fatalities per 100,000 residents, California drops to 8th place. The most dangerous state for pedestrians in 2022 was Louisiana, with a rate of pedestrian and cyclist fatalities 118.14% higher than the national average.
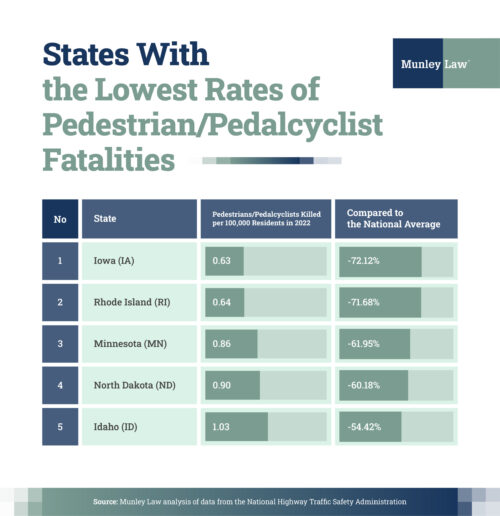
The safest state for pedestrians and cyclists in 2022 was Iowa, where the fatality rate was 72.12% lower than the national average. Less than 0.5% behind Iowa was Rhode Island, with a fatality rate 71.56% lower than the national average.
Where Do Drivers Wear Their Seatbelts The Least?
Wearing a seatbelt as a driver or front passenger can reduce your likelihood of death in a crash by about 60% in an SUV, van or pickup truck, and by about 45% in a car. Not wearing a seatbelt can also put other people in the car at risk — in the event of a crash, an unrestrained rear passenger increases the risk of fatality for the driver by 137%. Not wearing a seatbelt in the front seat of a car can also put the person sitting next to you at risk during a side-impact crash.
States with stricter penalties for noncompliance and stronger enforcement laws have higher rates of seatbelt use. In the past, raising no seatbelt fines from $25 to $100 was found to increase compliance by 6-7%.
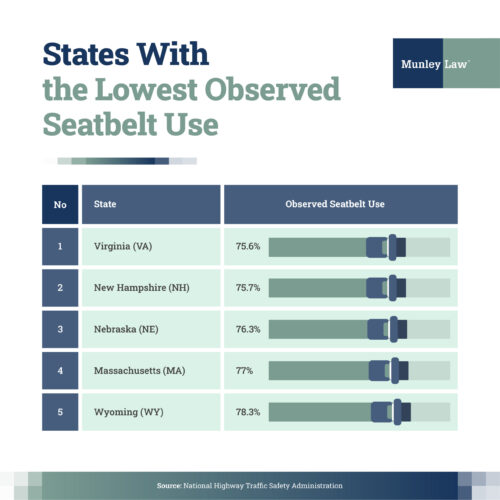
New Hampshire is the only state in the U.S. with no seatbelt requirements for adults. It also has the second lowest rate of observed seatbelt use in the country, at 75.7%. The worst state for seatbelt use in the U.S. is Virginia, with a marginally lower rate of 75.6%.
States With the Highest Percentage of Uninsured Drivers
If you are involved in an accident with another car and they are found to be at fault, their insurance is supposed to cover any repair and medical bills you may incur. But what if the other driver did not have insurance? If you did not purchase uninsured motorist coverage in addition to your regular policy, you may end up having to pay for your expenses out-of-pocket.
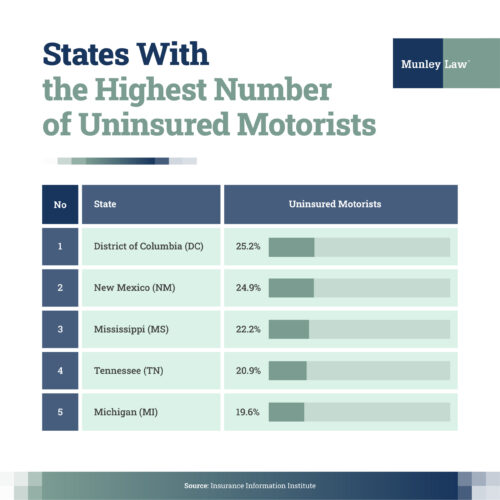
While purchasing car insurance is mandatory in all U.S. states apart from New Hampshire, many people still drive without it. In Washington, D.C., and New Mexico, approximately a quarter of all drivers do not have insurance.
The Deadliest Highways in America
Your state may have better drivers than others, but sometimes, it’s the road you must look for. Factors like outdated infrastructure, recurring bad weather, and sharp turns can make some roads much deadlier than average.
We analyzed 2022 fatal motor vehicle crash data from the NHTSA to find 10 highways in the U.S. with the highest rates of fatal crashes. Because longer roads usually have more accidents, we ranked these by fatal crashes per 100 miles of road.
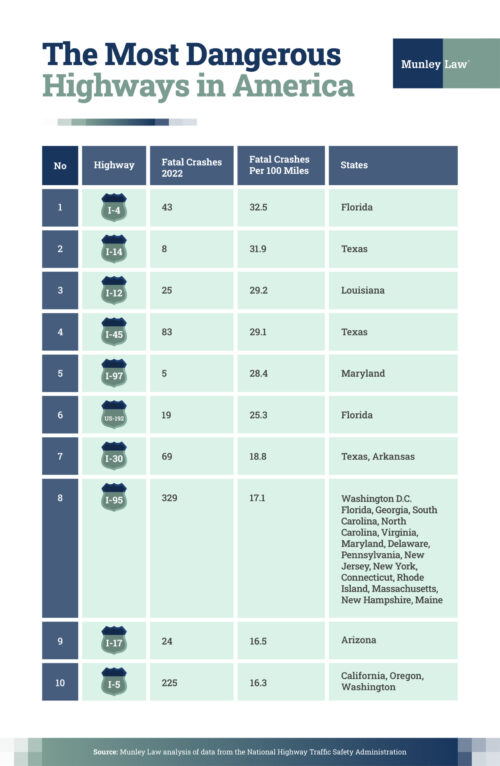
The most dangerous highway in the U.S. is Interstate 4, a 132-mile stretch between Tampa and Daytona in Florida. In 2022, the I-4 had approximately one fatal crash for every three miles of highway.
What You Should Do To Stay Safe on the Road
Even if you live in a state where the other drivers are more dangerous than average, there are steps you can take to keep yourself as safe as possible.
One of the most important steps to staying safe is to always keep your full attention on driving when you are behind the wheel. There are a variety of things that can take our attention away from the road, whether that’s adjusting the radio or reaching for an object.
At 55 miles per hour, your car travels the full length of a football field in just five seconds. Other drivers around you can behave unpredictably, braking suddenly or cutting into your lane. If you aren’t paying attention, you may not be able to react in time.
Here are a few more things you can do to protect yourself on the road:
- Always keep a two-second gap between you and the car in front. This means that you stay far enough back that it will take you two seconds to reach them if they stop suddenly. This gives you enough time to react in case something happens.
- If you need to eat or drink, always pull over. It will only take a few minutes and could save your life.
- Make sure all passengers, including children, are always buckled in. This isn’t just for their safety — an unrestrained passenger can kill or seriously injure other people next to or in front of them during a crash.
- Check if any of your medications make you drowsy, and, if so, don’t drive after taking them. If you feel tired, it may be a good idea to pull over and take a nap.
Remember to always put your safety first when you’re on the road. If you’re driving to meet someone, they would much rather you arrive later than get into an accident.
Conclusion
Pedestrian fatalities in the U.S. are at their peak, and the percentage of fatal accidents caused by drunk driving is also at an all-time high. Overall, drivers in New Mexico, Mississippi and Wyoming exhibited the highest rates of negative road behaviors, while drivers in New York, New Jersey and Hawaii performed the best.
Methodology
To create our state ranking we compared the most recent available data for 9 key statistics related to traffic fatalities and road safety. State population data from the U.S. Census Bureau was used to find fatality, arrest and fatal crash rates per 100,000 residents. The datasets were then standardized through Z-score distributions and all outliers were capped at 2. The data for each state was averaged to produce a final score.
Here are our 9 metrics:
- Motor Vehicle Traffic Fatalities per 100,000 Residents 2023 — National Highway Traffic Safety Administration
- Arrests for DUI per 100,000 Residents 2022 — FBI Crime Data Explorer
- Drug Use Disorder in the Past Year 2021-2022 — Substance Abuse and Mental Health Services Administration
- Fatal Crashes per 100,000 Residents 2022 (Speeding) 2022 — National Highway Traffic Safety Administration
- Fatal Crashes per 100,000 Residents 2022 (Alcohol) 2022 — National Highway Traffic Safety Administration
- Pedestrians/Cyclists Killed In Motor Vehicle Accidents Per 100,000 Residents 2022 — National Highway Traffic Safety Administration
- Observed Seatbelt Use 2022 — National Highway Traffic Safety Administration
- Fatally Injured Occupants per 100,000 Residents (No Seatbelt) 2022 – National Highway Traffic Safety Administration
- Percentage of Uninsured Motorists 2022 — Insurance Information Institute
Posted in Car Accidents.