
Safest and Most Dangerous States to Drive
Labor Day Second-Most People Killed in Motor Vehicle Accidents Behind Only July 4th
An estimated 39,345 Americans were killed in traffic accidents in 2024, and according to the Centers for Disease Control and Prevention (CDC), accidents (of all kinds) are the third leading cause of death in America.
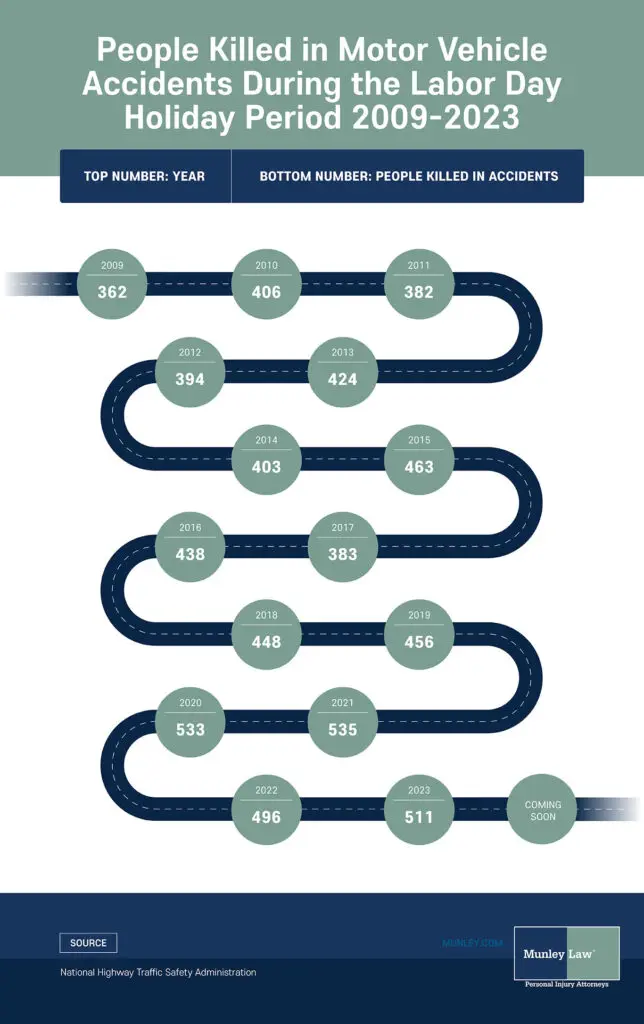
Motor vehicle accidents rise sharply during the summer months due to increased traffic and alcohol consumption as Americans take vacations. This helps explain why more people are killed in motor vehicle accidents on Labor Day than any other day, with the exception of July 4.
The latest data from the National Highway Traffic Safety Administration (NHTSA) shows that 511 people were killed in motor vehicle accidents during the 2023 Labor Day holiday period, up from 496 the previous year. Of these 511 people, 185 (36%) were killed in crashes that involved at least one person driving drunk and 62% of those impaired drivers clocking blood alcohol levels nearly double the legal limit (BAC .15+).
As Americans drive for Labor Day travel, BBQs, and celebrations – where there will be excessive drinking – it is important that they remain vigilant on the roads. Drivers must also be mindful of the increased number of pedestrians that will be taking walks and bike rides while enjoying the nice weather. An estimated 7,148 people were killed while walking in 2024, nearly 20% higher than 2016 levels, and those numbers spike during the summer months.
Of course, driving in some states is more dangerous than others. Our car accident lawyers crunched the numbers and figured out which states are the most risky for anyone taking a road trip this Labor Day weekend. We’ve also found the most dangerous road in every state, so motorists can be better informed and stay prepared.
What’s the Most Dangerous State for Drivers?
To find out the safest and most dangerous states to drive in 2025, we used the most recent federal data to analyze seven key factors in all 50 states and D.C.:
- Motor vehicle traffic fatalities per 100,000 residents
- DUI arrest rates per 100,000 residents
- Fatal car crashes where the driver had a blood alcohol level ≥ 0.08 g/dl per 100,000 residents
- Fatal crashes involving speeding per 100,000 residents
- Pedestrians killed by motor vehicles per 100,000 residents
- Motor carrier traffic violations per 100,000 residents
- Percentage of motorists in the state who are uninsured
The complete methodology with links to all sources is at the bottom of the study.
Key Findings
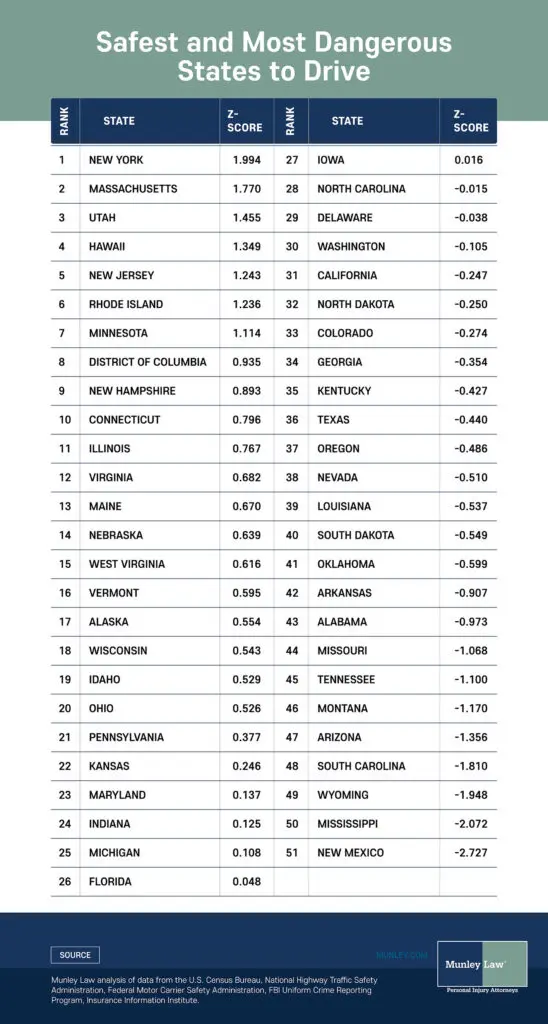
- New York is the No. 1 Safest State to Drive. Our New York auto accident attorneys found low motor vehicle fatalities (5.56 per 100,000 residents), low DUI arrests (69.39 per 100,000 residents), and low speeding-related fatal crashes (1.59 per 100k) combine to give New York the number one spot.
- The Northeast Dominates the Safest States. Massachusetts (#2) pairs 5.16 fatalities per 100,000 with one of the lowest speeding fatal crash rates (1.50). Rhode Island (#6) has the lowest fatality rate in the U.S. at 4.67 per 100,000.
- New Mexico is the Most Dangerous State (#51). High speeding-involved fatal crashes (5.59 per 100,000), the highest pedestrian death rate (4.93 per 100k), and the second highest uninsured driver rate in the U.S. (24.1%) put drivers and pedestrians at outsized risk.
- Mississippi has the Highest Fatality Rate in the US: at 24.57 per 100k; uninsured motorists also top the nation (28.2%).
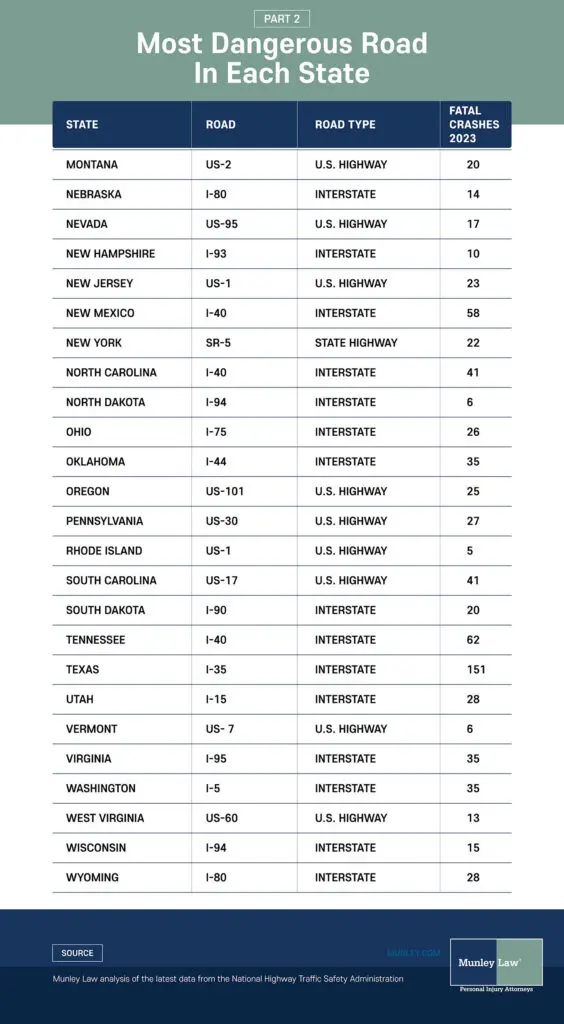
- Deadliest Roads Cluster on Major Interstates and U.S. Routes. I-35 in Texas (151 fatal crashes), US-1 in Florida (131 fatal crashes) and I-5 in California (119 fatal crashes) lead state-level lists.
Safest States to Drive
New York — No. 1 Overall
New York tops the list by keeping core risks low across the board. Motor vehicle traffic fatalities are 5.56 per 100,000 residents (#3), while DUI arrest rates are 69.39 per 100,000 residents (#3). Fatal crashes with BAC 0.08+ g/dl come out to 1.47 per 100,000 residents (#4), and fatal crashes involving speeding are 1.59 per 100,000 residents (#3). Motor carrier traffic violations total 154.21 per 100,000 residents (#11), and only 8.6% of the state’s drivers were uninsured (#8). The one area where New York has worse statistics is in the number of pedestrians killed in vehicle accidents, with 1.45 pedestrians per 100,000 residents (#18). However, even in this category, the state scores above average.
Massachusetts — No. 2 Overall
Massachusetts delivers consistently safe outcomes across the board, with good scores on speeding and alcohol-related crashes. Motor vehicle traffic fatalities are 5.16 per 100,000 residents (#2), and DUI arrests are 111.56 per 100,000 residents (#6). Fatal crashes with BAC 0.08+ g/dl are 1.47 per 100,000 residents (#3), and fatal crashes involving speeding are 1.50 per 100,000 residents (#2). Only 0.94 pedestrians per 100,000 residents were killed in vehicle accidents (#6). A relatively low 7.9% of motorists in the state are uninsured (#7). Massachusetts has one weak spot that holds it back: motor carrier traffic violations are 536.03 per 100,000 residents (#47).
Utah — No. 3 Overall
Utah combines strong insurance compliance with very low alcohol-involved crash rates. Motor vehicle traffic fatalities are 7.99 per 100,000 residents (#7), and DUI arrests are 248.17 per 100,000 residents (#24). Fatal crashes with BAC 0.08+ g/dl are 1.46 per 100,000 residents (#2), and fatal crashes involving speeding are 2.28 per 100,000 residents (#11). Pedestrians killed in vehicle accidents are 1.08 per 100,000 residents (#10). Motor carrier traffic violations are 265.84 per 100,000 residents (#28), and 6.2% of the state’s motorists are uninsured (#2).
Most Dangerous States to Drive
New Mexico — No. 51 Overall
New Mexico finishes last with the nation’s deadliest pedestrian environment, as well as elevated impairment and speeding. Motor vehicle traffic fatalities are 18.78 per 100,000 residents (#47), while DUI arrest rates are 258.94 per 100,000 residents (#27). Fatal crashes with BAC 0.08+ g/dl are 4.93 per 100,000 residents (#47), and fatal crashes involving speeding are 5.59 per 100,000 residents (#48). New Mexico has the highest rate of pedestrians killed in vehicle accidents, with 4.93 per 100,000 residents (#51). Motor carrier traffic violations are 872.20 per 100,000 residents (#49), and 24.1% of drivers are uninsured (#50).
Mississippi — No. 50 Overall
Mississippi’s challenge is the sheer number of fatal crashes and the highest percentage of uninsured drivers in the U.S. Motor vehicle traffic fatalities are highest in the nation, with 24.57 per 100,000 residents (#51), while DUI arrest rates are 410.77 per 100,000 residents (#48). Fatal crashes with BAC 0.08+ g/dl are 4.72 per 100,000 residents (#44), and fatal crashes involving speeding are 4.21 per 100,000 residents (#41). Pedestrians killed in vehicle accidents are 2.92 per 100,000 residents (#45). Motor carrier traffic violations total 220.52 per 100,000 residents, a better-than-average score (#20), but 28.2% of drivers in the state are uninsured (#51).
Wyoming — No. 49 Overall
Wyoming struggles with the highest speeding-related fatal crash rate in the nation, 8.51 per 100,000 residents (#51). Motor carrier traffic violations are also highest in the nation, with 1,648.35 per 100,000 residents (#51). Motor vehicle traffic fatalities are 18.21 per 100,000 residents (#46), while DUI arrest rates are 490.97 per 100,000 residents (#49). Fatal crashes with BAC 0.08+ g/dl come out to 5.11 per 100,000 residents (#48). Wyoming’s wide stretches of road through unpopulated areas mean relatively fewer pedestrians killed in vehicle accidents, at 1.87 per 100,000 residents (#28), though it’s still a below-average score. One relative bright spot: only 6.7% of the state’s drivers are uninsured (#4).
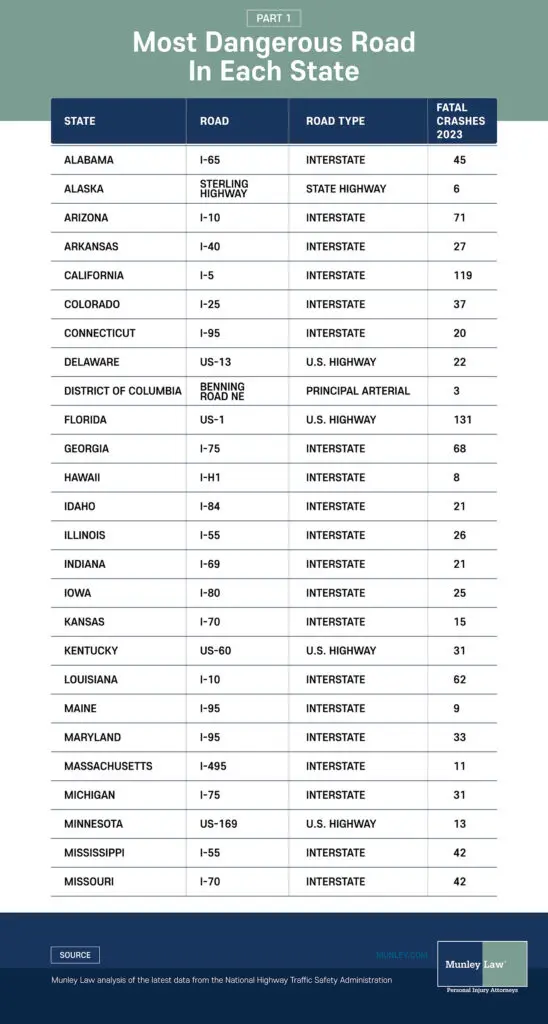
Across the country, the roads that rack up the most fatal crashes are overwhelmingly Interstates: 35 out of 51 states’ deadliest corridors are on the Interstate system. U.S. routes account for 13 states, with just two state highways and one principal arterial (Washington, D.C.’s Benning Road NE) rounding out the list.
Only three corridors crossed the 100-fatal-crash threshold in 2023: Texas’s I-35 (151 fatal crashes), Florida’s US-1 (131), and California’s I-5 (119). Below that top tier, long-haul interstates still dominate the high end — Arizona’s I-10 (71), Georgia’s I-75 (68), Tennessee’s I-40 (62), and Louisiana’s I-10 (62).
Several multi-state corridors repeat as the deadliest within multiple states. I-40 tops the list in Arkansas, Tennessee, New Mexico, and North Carolina, while I-95 is the deadliest road in Connecticut, Maine, Maryland, and Virginia. Among U.S. routes, US-1 leads in Florida, New Jersey, and Rhode Island.
At the other end of the spectrum, the lowest fatal crash count for the most dangerous road belongs to Washington, D.C.’s Benning Road NE, with only three fatal crashes.
5 Tips for Driver Safety
- Stay Sober and Alert – Never drive under the influence of alcohol, drugs, or medications that impair judgment or reaction time.
- Follow the Speed Limit – Speeding reduces reaction time and increases crash severity. Drive according to posted limits and road conditions.
- Avoid Distracted Driving – Keep your eyes on the road, hands on the wheel, and attention on driving. Avoid texting, eating, or adjusting controls while moving.
- Maintain a Safe Following Distance – Use the “three-second rule” to give yourself enough space to react to sudden stops.
- Buckle Up Every Time – Seat belts significantly reduce the risk of serious injury or death in a crash.
5 Tips for What to Do After an Accident
- Check for Injuries and Call 911 – Ensure everyone’s safety first, and request medical help if needed.
- Move to Safety – If possible, move vehicles out of traffic to a safe location.
- Document the Scene – Take photos of damage, license plates, road conditions, and gather witness information.
- Exchange Information – Share your name, contact details, insurance, and vehicle registration with the other driver(s).
- Consult a Car Accident Attorney – Especially if injuries, significant damage, or legal questions are involved, an attorney can protect your rights and help navigate insurance or legal claims.
Methodology
We created our state ranking by comparing the most recent available data for seven key statistics related to road safety. State population data from the U.S. Census Bureau was used to find rates per 100,000 residents, where applicable. The datasets were then standardized through Z-score distributions across all 50 states and D.C., and all outliers were capped at 2. A Z-score is a statistical measurement that describes a value’s relationship to the mean of a group of values. The data for each state was averaged to produce a final score. Here are the sources:
- Motor vehicle traffic fatalities per 100,000 residents, early estimates, 2024 — National Highway Traffic Safety Administration
- DUI arrest rates per 100,000 residents, 2024 — FBI Crime Data Explorer
- Fatal crashes where driver had a blood alcohol level ≥ 0.08 g/dl per 100,000 residents, 2023 — NHTSA Fatality Analysis Reporting System
- Fatal crashes involving speeding per 100,000 residents, 2023 — NHTSA Fatality Analysis Reporting System
- Pedestrians killed by motor vehicles per 100,000 residents, 2023 — NHTSA Fatality Analysis Reporting System
- Motor carrier traffic violations per 100,000 residents, 2024 — Federal Motor Carrier Safety Administration
- Percentage of uninsured motorists 2023 — Insurance Information Institute
Posted in Car Accidents.


